调试攻坚
你的代码一定会包含 bug。每一个专业程序员都希望自己能写出没有 bug 的代码,但现实是:真正能做到这一点的软件工程师少之又少。任何一个计算机用户都知道,bug 在软件世界里几乎是常态。你写的软件大概率也不会例外。因此,除非你打算靠贿赂同事来帮你修掉所有 bug,否则你不可能在不了解如何调试 C++ 代码的前提下,成为一个专业的 C++ 程序员。很多时候,经验丰富的程序员和新手程序员之间,一个非常显著的差别就在于调试能力。
尽管调试显然如此重要,它在课程和书籍中却很少得到足够重视。调试似乎总是一种“所有人都默认你该会,但谁也说不清该怎么教”的技能。本章的目标,就是尽量给出一些具体、可操作的调试准则与技巧。
本章将从调试的基本法则与 bug 分类开始,接着给出一些避免 bug 的建议。随后会讨论如何“为 bug 提前做准备”,包括错误日志、调试跟踪、断言和崩溃转储。之后,本章还会分别介绍:如何重现 bug、如何调试可重现 bug、如何调试不可重现 bug、如何调试回归问题、如何处理内存错误,以及如何调试多线程程序。最后,本章会以一个循序渐进的调试示例收尾。
调试的基本法则
Section titled “调试的基本法则”调试的第一条规则,就是对自己诚实:承认你的代码一定会有 bug。只有在这种现实判断之下,你才能一边尽最大努力避免 bug 爬进代码,一边又在程序中预先放入那些能让调试尽可能容易的设施。
调试的基本法则就是:写代码时要尽量避免 bug,但同时也要为代码中出现 bug 提前做好准备。
Bug 分类
Section titled “Bug 分类”计算机程序中的 bug,本质上就是“不正确的运行期行为”。这种不受欢迎的行为既包括 catastrophic bug,也包括 noncatastrophic bug。catastrophic bug 的例子包括:程序崩溃、数据损坏、操作系统失效,或者其他更可怕的后果。catastrophic bug 的影响甚至还可能蔓延到软件系统之外;例如,某个医疗软件中的 catastrophic bug,可能会导致患者受到过量辐射。相比之下,noncatastrophic bug 则往往更隐蔽:程序并不会直接炸掉,但行为却悄悄变错了。比如,一个 web browser 返回了错误网页,或者一个 spreadsheet 程序计算某一列的标准差时结果不正确。这类 bug 也常被称为 logical bug。
还有一类 cosmetic bug:也就是视觉层面不对劲,但功能上大体还能工作。例如,某个 user interface 中的按钮明明不该可点,却仍保持 enabled 状态;不过真点下去也不会发生任何事。程序计算完全正确,也没有崩溃,只是看起来没有达到应有的“整洁和正确”。
而 bug 的底层原因,也就是它的 root cause,是程序中那个导致错误行为的真正失误。调试一个程序,不仅包括找出 bug 的 root cause,也包括修改代码,确保这个 bug 不会再次出现。
避免 Bug
Section titled “避免 Bug”完全写出没有 bug 的代码是不可能的,因此 debugging 技能非常重要。不过,下面这些建议至少可以帮助你尽量减少 bug 数量:
- 把这本书从头到尾读完: 深入掌握 C++ 语言,尤其是 pointer 和 memory management。然后,把这本书推荐给你的朋友和同事,好让他们也少写一点 bug。
- 先 design,再 coding: 对某个 feature 完全不想 design,直接开写,通常只会得到更绕、更难懂、更容易出错的实现。它还会让你更容易遗漏边界情况和错误条件。因此,在真正开始写代码前,先花时间思考 design。当然,一旦实现过程中出现你之前没想到的问题,也不要害怕修改 design——开始实现之后再调整设计,本身完全没有问题。
- 做 code review: 在专业环境里,每一行代码原则上都应接受 peer review。很多时候,只要换一个视角看,就能发现原本没注意到的问题。
- 测试,测试,再测试: 彻底测试你的代码,也让别人来测试你的代码。他们更有可能发现你自己根本没想到的问题。
- 写自动化 unit test: unit test 用于测试隔离出来的单一功能。所有实现出来的 feature 都应有 unit test 覆盖。你应该把它们纳入 continuous integration,或至少在每次本地编译后自动运行。第 30 章“精通测试”已经详细讨论过 unit testing。
- 预期错误条件会出现,并正确处理它们: 特别是在处理文件和网络连接时,你必须提前计划并正确处理错误。错误一定会发生。详见第 13 章“揭开 C++ I/O 的面纱”和第 14 章“错误处理”。
- 使用 smart pointer 避免资源泄漏: smart pointer 会在资源不再需要时自动释放它们。
- 不要忽略 compiler warning: 把 compiler 配置到较高 warning level。不要盲目无视 warning。理想情况下,你甚至应该让 compiler 把 warning 当成 error。这样你就会被迫立即处理每一个 warning。在 GCC 或 Clang 中,可以传入
-Werror来把全部 warning 当成 error。在 Visual C++ 中,则可以打开项目属性,进入 Configuration Properties ➪ C/C++ ➪ General,启用 Treat Warnings As Errors。 - 使用 static code analysis: static code analyzer 通过分析 source code 来帮助发现潜在问题。理想状态是,它能在 IDE 中边写边分析,以尽早发现问题;也可以让 build process 自动运行它。网络上有很多 analyzer,既有免费也有商业方案。
- 保持良好 coding style: 追求可读性和清晰度,使用有意义的名字,不要随意缩写,添加代码注释(不仅是接口注释),用上
override和explicit等关键字,等等。这会让别人更容易理解你的代码。
为 Bug 提前做准备
Section titled “为 Bug 提前做准备”你的程序里应当包含一些“让 debugging 更容易”的能力,因为 bug 迟早都会出现。本节会介绍一些这类能力,并在适当之处给出示例实现,方便你将它们整合进自己的程序中。
想象这样一个场景:你刚刚发布了旗舰产品的新版本,结果最早的一批用户之一就反馈说程序“突然不能用了”。你费尽力气从用户嘴里撬出更多信息,最后只知道:程序是在某个操作进行到一半时挂掉的。用户自己也记不太清当时到底在做什么,更不知道有没有弹过 error message。面对这种情况,你打算怎么 debug?
现在再想象一遍同样场景,但这一次,除了用户提供的模糊信息之外,你还可以查看用户机器上的 error log。于是你在 log 中看到:程序记录了一条消息——“Error: unable to open config.xml file.” 接着你顺着这条日志回头看那附近代码,发现有一行代码在读取文件时根本没有检查文件是否真的成功打开。你就这样找到了 bug 的 root cause。
Error logging 指的是:把 error message 写入持久化存储中,从而确保即便应用程序,甚至整台机器崩溃之后,这些信息仍然能被保留下来。尽管前面的例子已经足够说明问题,你也许还是会怀疑:真有必要这样做吗?程序遇到错误时,不是会在行为上自己暴露出来吗?用户难道不会注意到哪里不对?正如刚才的场景所示,用户报告往往并不完整,也不准确。此外,很多程序——比如 operating system kernel,或者 Unix 上像 inetd(internet service daemon)和 syslogd 这类长期运行的 daemon——本来就不是交互式的,它们会在机器上无人值守地运行。对这种程序而言,向用户传达信息的唯一手段,往往就是 error logging。在很多情况下,程序也可能希望对某些错误做自动恢复,并把这些错误对用户完全隐藏起来。即便如此,把这些错误完整记录下来,仍然会对提升程序整体稳定性极其有价值。
因此,程序在遇到 error 时就应当立即记录它们。这样一来,一旦用户报告 bug,你就能检查目标机器上的 log file,看程序在 bug 发生前是否已经报过什么错误。当然,error logging 是平台相关的:C++ 本身并没有标准化的 logging mechanism。平台上的例子包括 Unix 中的 syslog 设施,以及 Windows 中的 event reporting API。具体如何使用,应查询你目标开发平台的文档。除此之外,也有一些开源的跨平台 logging framework 实现,例如:
- log4cpp:
log4cpp.sourceforge.net - Boost.Log:
boost.org
既然你现在已经相信 logging 对程序很有价值,那么你可能会立刻产生另一个冲动:是不是应该每隔几行代码就记一条日志,这样等 bug 出现时,就能完整追出当时执行过的代码路径?这类日志消息通常被称为 trace。
不过,你不应该把这类 trace 直接写入 log file,原因有两个。第一,向持久化存储写数据很慢。即便系统异步写日志,这么高频地写日志,仍然会拖慢你的程序。第二,也是更重要的一点:trace 中的大部分信息根本不适合最终用户看到。它只会让用户困惑,甚至引发完全不必要的服务请求。当然,在合适的场景下,tracing 仍是一项非常重要的 debugging technique——下一节就会具体讨论。
下面是一些适合写入 error log 的错误类型:
- 不可恢复的错误,例如某个 system call 意外失败。
- 管理员可以采取行动的错误,例如内存不足、数据文件格式不正确、无法写磁盘,或者网络连接中断。
- 非预期错误,例如某条你本以为绝不会走到的代码路径真的被执行,或者某个变量出现了完全意外的值。相反,如果用户输入非法数据,这本应当是你的代码“预期之内”的事情,并应被妥善处理;真正的“unexpected error”意味着程序存在 bug。
- 潜在安全问题,例如来自未授权地址的网络连接尝试,或过多的连接尝试(denial of service)。
你也许会自然追问:一条 logged error 中到底应包含什么信息?至少,每一条都应包含错误发生的日期与时间,以及错误消息本身。在 multithreaded application 中,把触发错误的线程 ID 也一并记录下来会很有帮助。自 C++23 起,Standard Library 还提供了 std::stacktrace(见第 14 章),它让你能在程序执行过程中的任意时刻获取 stack trace。你甚至可以把整段 stack trace、或者至少其中一部分,连同错误一起写进 log。
除了 error,本书也建议你记录 warning——也就是可恢复错误。这样,你就能进一步分析:它们是否有机会被彻底避免。
大多数 logging API 都允许你为日志指定 log level 或 error level,通常至少包括 “error”、“warning” 和 “info”。这样,即便某些情况还不算 error,你也可以用低于 “error” 的 level 记录它们。例如,你可能想把应用中的一些重要状态变化,或者程序的启动与关闭过程记录下来。你甚至还可以考虑给用户提供一种方式,让他们在运行期动态调整程序的 log level,以便控制日志量。
在调试复杂问题时,面对用户的公共错误提示,通常远远不够。你往往需要知道完整的代码路径,或者 bug 出现前某些变量的具体值。除了基础 error message 之外,有时在 debug trace 中加入下列信息会非常有帮助:
- 如果程序是 multithreaded 的,则加入线程 ID
- 生成这条 trace 的函数名
- 该函数所在 source file 的文件名
你可以通过特殊的 debug mode,或者通过 ring buffer 机制,把这类 tracing 功能加进程序。下面几节会分别详细解释这两种技术。需要注意的是,在 multithreaded program 中,trace logging 也必须是 thread-safe 的。多线程相关内容见第 27 章“使用 C++ 进行多线程编程”。
Trace file 可以写成文本格式,但如果你这样做,一定要谨慎控制记录细节的程度。你绝不希望自己的 intellectual property 通过 log file 泄露出去;而且,一旦 trace 输出落到攻击者手里,过多 implementation detail 本身也会带来风险。
加入 debug trace 的第一种方式,是为程序提供 debug mode。在 debug mode 下,程序会把 trace 输出写到标准错误流或某个文件里,甚至还可能在运行过程中做额外检查。给程序加入 debug mode 的方式有很多。下面这些示例都会把 trace 以文本形式输出。
启动时调试模式
Section titled “启动时调试模式”Start-time debug mode 指的是:程序是否启用 debug mode,由命令行参数决定。这种策略会把 debug 代码编译进 “release” binary,因此也允许你在客户现场直接启用 debug mode。不过,它也有一个明显缺点:用户必须先重启程序,才能让程序以 debug mode 运行;这会让某些 bug 的现场信息根本来不及被保留下来。
下面这个简单程序演示了 start-time debug mode 的实现方式。它本身并不做什么有用的事,只是为了展示这种技术。
所有 logging 功能都被包装进一个 Logger class 中。这个类包含两个 static 数据成员:日志文件名,以及一个表示 logging 当前是否启用的 Boolean。类中提供了一个 public static log() 成员函数模板。像这种 variadic template 已在第 26 章“高级模板”中讨论过。每次调用 log() 时,日志文件都会被打开、写入、刷新并关闭。这样做在 performance 上也许会稍差一点,但它能更可靠地保证日志正确落盘——而这通常更重要。
class Logger{    public:        static void enableLogging(bool enable) { ms_loggingEnabled = enable; }        static bool isLoggingEnabled() { return ms_loggingEnabled; }
        template <typename... Args>        static void log(const Args&... args)        {            if (!ms_loggingEnabled) { return; }
            ofstream logfile { ms_debugFilename, ios_base::app };            if (logfile.fail()) {                println(cerr, "Unable to open debug file!");                return;            }            print(logfile, "{:L} UTC: ", chrono::system_clock::now());            // Use a fold-expression; see Chapter 26.            (logfile << ... << args);            logfile << endl;        }    private:        static inline const string ms_debugFilename { "debugfile.out" };        static inline bool ms_loggingEnabled { false };};
为了更方便地记录日志,下面还定义了一个辅助 macro LOG()。它接收可变数量参数,并通过 __VA_ARGS__ 访问这些参数。这个 macro 还用到了 __func__——它是 C++ 标准预定义的一个变量,表示当前函数名。
#define LOG(...) Logger::log(__func__, "(): ", __VA_ARGS__)这个 macro 会把代码中每一次 LOG() 调用,都替换成对 Logger::log() 的调用,并自动把当前函数名作为第一参数传入。例如,假设你这样使用它:
LOG("The value is: ", value);那么 LOG() 宏展开后的结果就是:
Logger::log(__func__, "(): ", "The value is: ", value);Start-time debug mode 还需要解析命令行参数,判断是否应启用 debug mode。遗憾的是,C++ 标准并没有提供标准化的命令行参数解析工具。这个程序用一个简单的 isDebugSet() 函数,在全部命令行参数里查找 debug 标志;真实项目里,如果你要完整解析全部命令行参数,这个函数当然会复杂得多。
bool isDebugSet(int argc, char** argv){ auto parameters { views::counted(argv, argc) }; return ranges::contains(parameters, string_view { "-d" });}为了演示这套 debug mode,下面给出一些随意的测试代码。它定义了两个类:ComplicatedClass 和 UserCommand。这两个类都实现了 operator<<,以便能把对象写入 stream;Logger 正是通过这个运算符,把对象内容导入 log file。
class ComplicatedClass { /* ... */ };ostream& operator<<(ostream& outStream, const ComplicatedClass& src){    outStream << "ComplicatedClass";    return outStream;}
class UserCommand { /* ... */ };ostream& operator<<(ostream& outStream, const UserCommand& src){    outStream << "UserCommand";    return outStream;}
下面这段测试代码中,有若干处会写入日志:
UserCommand getNextCommand(ComplicatedClass* obj){    UserCommand cmd;    return cmd;}
void processUserCommand(const UserCommand& cmd){    // Details omitted for brevity.}
void trickyFunction(ComplicatedClass* obj){    LOG("given argument: ", *obj);
    for (size_t i { 0 }; i < 100; ++i) {        UserCommand cmd { getNextCommand(obj) };        LOG("retrieved cmd ", i, ": ", cmd);
        try {            processUserCommand(cmd);        } catch (const exception& e) {            LOG("exception from processUserCommand(): ", e.what());        }    }}
int main(int argc, char** argv){    Logger::enableLogging(isDebugSet(argc, argv));
    if (Logger::isLoggingEnabled()) {        // Print the command-line arguments to the trace.        for (size_t i { 0 }; i < argc; ++i) {            LOG("Argument: ", argv[i]);        }    }
    ComplicatedClass obj;    trickyFunction(&obj);
    // Rest of the function not shown.}
这个应用有两种运行方式:
> STDebug> STDebug -d只有在命令行上显式带上 -d 参数时,debug mode 才会启用。
在 C++ 中,应尽量避免使用 macro,因为它们本身就很难 debug。不过,在 logging 这种特定用途上,使用一个简单 macro 仍然是可以接受的,而且会让 logging 代码用起来方便很多。即便如此,有了第 14 章中讲过的 std::source_location,这个例子其实也可以改写成完全不使用 macro 的版本。本章末尾的一道练习就会让你处理这个问题。
编译期调试模式
Section titled “编译期调试模式”除了通过命令行参数启用/禁用 debug mode,你也可以使用某个 preprocessor symbol(例如 DEBUG_MODE),再配合 #ifdef,让 debug 代码按需编译进程序。若要生成这个程序的 debug 版本,你就必须在编译时定义 DEBUG_MODE 这个 symbol。不同 compiler 都允许你在编译期间定义 symbol,具体语法请查阅相应文档。例如 GCC 支持在命令行上传入 -Dsymbol;Microsoft Visual C++ 则允许通过 Visual Studio IDE,或者通过命令行工具中的 /D symbol 来定义。除了自定义的 DEBUG_MODE 外,你也可以利用 NDEBUG:它通常在 release build 中由 compiler 定义,而在 debug build 中不会定义。
这种方式的好处在于:debug 代码不会被编译进 “release” binary,因此不会增加其体积。坏处则是:在客户现场,你将无法临时打开 debug mode 进行排查。
下载源码包中的 CTDebug.cpp 给出了一个完整实现。这里特别值得注意的一点,是它对 LOG() 宏的定义如下:
#ifdef DEBUG_MODE #define LOG(...) Logger::log(__func__, "(): ", __VA_ARGS__)#else #define LOG(...) (void)0#endif也就是说,如果 DEBUG_MODE 没有被定义,那么代码里所有 LOG() 调用都会被替换成空操作(no-op)。
千万不要把“对程序正确运行至关重要、必须执行的代码”塞进 LOG() 调用里。那样会非常危险。
由于 logging code 在 DEBUG_MODE 未定义时会被整块移除,一些变量因此可能变成“未使用”,进而触发 compiler warning。你可以使用 [[maybe_unused]] attribute(见第 1 章“C++ 与标准库速成”)来避免这类 warning。例如:
int main([[maybe_unused]] int argc, [[maybe_unused]] char** argv){#ifdef DEBUG_MODE // Print the command-line arguments to the trace. for (size_t i { 0 }; i < argc; ++i) { LOG("Argument: ", argv[i]); }#endif ComplicatedClass obj; trickyFunction(&obj); // Rest of the function not shown.}运行期调试模式
Section titled “运行期调试模式”提供 debug mode 最灵活的方式,是让它在运行期被启用或关闭。实现这种特性的一个办法,是提供某种异步接口,让它可以动态控制 debug mode。这种接口可以是某个异步命令,通过进程间通信进入应用(例如使用 socket、signal 或 remote procedure call);也可以直接表现为 user interface 上的某个菜单命令。由于 C++ 标准既不提供标准化的 interprocess communication,也不提供标准 UI 机制,因此这里不再展示这一方案的完整代码。
debug mode 对调试可重现 bug、以及跑测试时都很有价值。但现实中的 bug 往往发生在程序并未开启 debug mode 的时候;而等到你或客户意识到问题、再去开启 debug mode 时,往往已经来不及捕获当时的现场信息了。一个解决思路,是让程序始终保持 tracing 开启状态。通常情况下,你真正需要的其实只是最近那一段 trace,而不是程序从启动到现在所有的 trace。因此,你应只保留执行过程中“最新的一小段 trace”。实现这一点的一种办法,是小心使用 log file rotation。
不过,从 performance 角度考虑,持续把 trace 写盘通常并不划算。更好的方式是:把这些 trace 暂时保存在内存里,并在需要时提供一种机制,把它们统一导出到标准错误流或 log file 中。
一种常见技巧,就是使用 ring buffer,也叫 circular buffer。它会保存固定数量的消息,或者说在固定的一块内存中保存尽可能多的消息。一旦 buffer 被写满,它就会从头开始覆盖,把更旧的消息替换掉;这个循环可以无限持续。下面几节会先给出 ring buffer 的实现,然后展示它在程序中的用法。
环形缓冲区接口
Section titled “环形缓冲区接口”下面这个 RingBuffer 类实现了一个简单 ring buffer,用来保存消息。client 在构造函数中指定可容纳的 entry 数量,并通过 addEntry() 成员函数向其中加入消息。一旦 entry 数量超过可容纳上限,新消息就会覆盖最旧消息。该 buffer 还支持“在消息写入 buffer 的同时,也把它们输出到某个 stream”这一可选能力。client 可以在构造函数中指定输出 stream,也可以之后通过 setOutput() 成员函数重置它。最后,operator<< 会把整个 buffer 内容写到输出 stream 中。这个实现内部用到了 variadic template 成员函数,相关内容见第 26 章。
export class RingBuffer final{    public:        // Constructs a ring buffer with space for numEntries.        // Entries are written to *outStream as they are queued (optional).        explicit RingBuffer(std::size_t numEntries = DefaultNumEntries,            std::ostream* outStream = nullptr);
        // Adds an entry to the ring buffer, possibly overwriting the        // oldest entry in the buffer (if the buffer is full).        template <typename... Args>        void addEntry(const Args&... args)        {            std::ostringstream oss;            std::print(oss, "{:L} UTC: ", std::chrono::system_clock::now());            // Use a fold-expression; see Chapter 26.            (oss << ... << args);            addStringEntry(std::move(oss).str());        }
        // Streams the buffer entries, separated by newlines, to outStream.        friend std::ostream& operator<<(std::ostream& outStream, RingBuffer& rb);
        // Streams entries as they are added to the given stream.        // Specify nullptr to disable this feature.        // Returns the old output stream.        std::ostream* setOutput(std::ostream* newOutStream);
    private:        std::vector<std::string> m_entries;        std::vector<std::string>::iterator m_next;
        std::ostream* m_outStream { nullptr };        bool m_wrapped { false };
        static constexpr std::size_t DefaultNumEntries { 500 };
        void addStringEntry(std::string entry);};
环形缓冲区实现
Section titled “环形缓冲区实现”这个 ring buffer 的实现,会在内部保存固定数量的 string object。严格来说,这并不是最高效的方案。另一种可能,是直接为 buffer 预留固定字节数的内存。不过,除非你正在编写对性能极度敏感的应用,否则这样的实现通常已经足够。
对于 multithreaded program 来说,把线程 ID 一并写入每条 trace entry 往往会很有帮助。当然,在真正把它用到多线程应用之前,ring buffer 本身必须先被改成 thread-safe。相关内容见第 27 章“使用 C++ 进行多线程编程”。
下面给出具体实现:
// Initialize the vector to hold exactly numEntries. The vector size// does not need to change during the lifetime of the object.// Initialize the other members.RingBuffer::RingBuffer(size_t numEntries, ostream* outStream)    : m_entries { numEntries }, m_outStream { outStream }, m_wrapped { false }{    if (numEntries == 0) {        throw invalid_argument { "Number of entries must be > 0." };    }    m_next = begin(m_entries);}
// The addStringEntry algorithm is pretty simple: add the entry to the next// free spot, then reset m_next to indicate the free spot after// that. If m_next reaches the end of the vector, it starts over at 0.//// The buffer needs to know if the buffer has wrapped or not so// that it knows whether to print the entries past m_next in operator<<.void RingBuffer::addStringEntry(string entry){    // If there is a valid m_outStream, write this entry to it.    if (m_outStream) { *m_outStream << entry << endl; }
    // Move the entry to the next free spot and increment    // m_next to point to the free spot after that.    *m_next = move(entry);    ++m_next;
    // Check if we've reached the end of the buffer. If so, we need to wrap.    if (m_next == end(m_entries)) {        m_next = begin(m_entries);        m_wrapped = true;    }}
// Set the output stream.ostream* RingBuffer::setOutput(ostream* newOutStream){    return exchange(m_outStream, newOutStream);}
// operator<< uses an ostream_iterator to "copy" entries directly// from the vector to the output stream.//// operator<< must print the entries in order. If the buffer has wrapped,// the earliest entry is one past the most recent entry, which is the entry// indicated by m_next. So, first print from entry m_next to the end.//// Then (even if the buffer hasn't wrapped) print from beginning to m_next-1.ostream& operator<<(ostream& outStream, RingBuffer& rb){    if (rb.m_wrapped) {        // If the buffer has wrapped, print the elements from        // the earliest entry to the end.        copy(rb.m_next, end(rb.m_entries),            ostream_iterator<string>{ outStream, "\n" });    }
    // Now, print up to the most recent entry.    // Go up to m_next because the range is not inclusive on the right side.    copy(begin(rb.m_entries), rb.m_next,        ostream_iterator<string>{ outStream, "\n" });
    return outStream;}
使用环形缓冲区
Section titled “使用环形缓冲区”要使用 ring buffer,你只需创建一个实例,然后不断往里面添加消息。当你希望把 buffer 内容打印出来时,只要通过 operator<< 把它写到合适的 ostream 即可。下面是把前面那个 start-time debug mode 程序改成使用 ring buffer 的版本。变化之处已标出。ComplicatedClass、UserCommand、getNextCommand()、processUserCommand() 和 trickyFunction() 的定义这里不再重复,它们与前面完全相同。
RingBuffer debugBuffer;
#define LOG(...) debugBuffer.addEntry(__func__, "(): ", __VA_ARGS__)
int main(int argc, char** argv){    // Log the command-line arguments.    for (size_t i { 0 }; i < argc; ++i) {        LOG("Argument: ", argv[i]);    }
    ComplicatedClass obj;    trickyFunction(&obj);
    // Print the current contents of the debug buffer to cout.    cout << debugBuffer;}
显示环形缓冲区内容
Section titled “显示环形缓冲区内容”把 debug trace 消息保存在内存里,是一个很好的开始;但若想让它们在 debugging 中真正有用,你还需要一种方式把这些 trace 取出来。
你的程序应提供某种 “hook”,让外界能够命令它导出这些消息。这个 hook 可以与运行期启用 debug mode 的接口类似。此外,如果程序遇到 fatal error 并即将退出,它也完全可以在退出前自动把 ring buffer 内容导出到某个 log file。
另一种取得这些消息的方式,是获得程序的 memory dump。不同平台对 memory dump 的处理方式差异很大,因此你需要查阅你所用平台的参考资料,或直接请教该平台的专家。
<cassert> 定义了 assert() macro。它接受一个 Boolean expression;若表达式求值为 false,就会打印错误信息并终止程序;若表达式求值为 true,则什么也不做。
通常来说,应尽量避免任何“可能直接终止程序”的库函数或 macro。但 assert() 是一个例外。只要 assertion 被触发,就意味着某个假设本身就是错的,或者某件事已经以一种灾难性、不可恢复的方式出了问题。在这种情况下,唯一理智的做法,就是立刻终止应用,而不是继续带着错误状态往下跑。
assertion 的价值,在于它能“强迫”程序在 bug 最初产生的那个点立刻暴露问题。如果你不在那里 assert,那么程序很可能会带着错误值继续执行,而 bug 要到更靠后的地方才会显现出来。因此,assertion 可以帮助你比平时更早发现 bug。
assert() 是一个 C 风格 macro,其实现依赖于 client code 是否定义了 NDEBUG。这也使 <cassert> 成为一个典型的 non-modular, non-importable header——相关讨论见第 11 章“模块、头文件与其他主题”。想使用 assert(),应写 #include <cassert>,而不是 import <cassert>。
只要你的代码“在某个点上对变量状态做出了假设”,你就可以考虑使用 assertion。例如,假设你调用了某个库函数,而它声称永远不会返回 nullptr,那么就在函数调用之后立刻加一条 assert(),确保那个 pointer 的确不是 nullptr。
不过,应尽量少做假设。比如,如果你正在编写一个库函数,就不应直接断言调用者传入的参数一定有效。更合理的做法是:显式检查参数,若无效,则返回 error code,或者抛出 exception。
一般来说,assertion 只应用在那些真正严重的问题上,也就是说:一旦在开发过程中触发了 assertion,这件事就不应被忽略。如果某个 assertion 在开发时被撞到了,那么你该做的是修问题,而不是把 assertion 关掉。
来看几个如何使用 assert() 的简单例子。下面这个 process() 函数要求传入的 vector 必须恰好包含三个元素:
void process(const vector<int>& coordinate){ assert(coordinate.size() == 3); // ...}如果 process() 被传入一个元素数小于或大于三的 vector,那么 assertion 就会失败,并产生类似下面这样的消息(具体消息格式取决于你所用的 compiler):
Assertion failed: coordinate.size() == 3, file D:\test\test.cpp, line 12如果你希望看到自定义错误信息,可以利用逗号运算符,再配上一层额外括号,使用下面这个技巧:
assert(("A custom message...", coordinate.size() == 3));这时,输出会类似如下:
Assertion failed: ("A custom message...", coordinate.size() == 3), file D:\test\test.cpp, line 106如果你希望在某个位置“无条件让 assert 失败,并带上特定消息”,可以使用下面这个技巧:
assert(!"This should never happen.");要特别小心:不要把“程序正确运行所必需执行的代码”写进 assertion 里面。那样很容易埋雷。
确保你的程序能生成 crash dump,也叫 memory dump 或 core dump。crash dump 是应用崩溃时生成的一种转储文件,它包含崩溃当时有哪些线程仍在运行、各线程的 call stack,等等。至于如何生成这类 dump,完全依赖平台,因此你应查阅目标平台文档,或者使用第三方库来代劳。Breakpad(github.com/google/breakpad/)就是一个这样的跨平台开源库,可以写入并处理 crash dump。
同时,也别忘了建立 symbol server 和 version control server。symbol server 用于保存你已经发布出去的二进制版本所对应的 debugging symbol;之后,当客户把 crash dump 发回来时,这些 symbol 就会被用来正确解释 dump 中的信息。而 version control server(见第 28 章“软件工程方法”)则负责保存全部 source code revision。在分析 crash dump 时,它还能帮助你取回“生成该 dump 的那个软件版本”所对应的正确源代码。
至于具体该如何分析 crash dump,依赖你的平台和 compiler;请查阅它们各自的文档。
根据我个人经验,一份 crash dump 往往值一千条 bug report。
调试程序可能会让人非常挫败。不过,只要方法足够系统,这件事就会明显容易得多。你在尝试调试一个程序时,第一步永远都应当是:reproduce the bug。而根据 bug 是否可重现,后续策略也会完全不同。接下来的四节会依次讨论:如何重现 bug、如何调试可重现 bug、如何调试不可重现 bug,以及如何调试 regression。之后还会继续展开 memory error 和 multithreaded program 的调试细节。最后,本章会给出一个 step-by-step 的 debugging 示例。
重现 Bug
Section titled “重现 Bug”如果你能稳定重现某个 bug,那么找出其 root cause 就会容易得多。有时,某个 bug 对 Alice 来说稳定可重现,而对 Bob 却完全不可重现;仅这一点本身,就可能成为 Alice 找出根因的重要线索。至于那些根本无法重现的 bug,想要真正查出原因,往往极其困难,甚至几乎不可能。
为了重现 bug,第一步应当是在尽量相似的环境中运行程序:同样的硬件、操作系统,以及与 bug 初次出现时尽可能相同的全部输入。这里的“输入”不仅包括触发 bug 的那一步动作,而是从程序启动开始,到 bug 出现那一刻为止的全部操作。一个非常常见的错误,是试图只复现“最后的触发动作”。这种做法经常会失败,因为 bug 可能并不是由那一个动作独立引起的,而是由一整串操作积累出来的结果。
例如,如果你的 web browser 在请求某个特定网页时崩溃了,这可能是因为该请求的网络地址触发了某种内存损坏。但它也可能是因为程序把所有请求都记录进一个最多容纳一百万条记录的队列,而这个请求恰好是第 1,000,001 条。在这种情况下,重启程序后只发出那一个请求,当然不可能重现 bug。
有时,你根本无法完整重演导致 bug 的整个事件链。也许 bug 是由某位根本记不清自己做过什么的用户报告的;又或者,程序已经运行太久,不现实从头到尾完整模拟所有输入。这种情况下,你只能尽最大努力去逼近原始情形。它确实会很耗时,也需要大量猜测,但前期在这里多下点功夫,往往能在后面的调试过程中省掉更多时间。你可以尝试下面这些做法:
- 在尽量正确的环境中,重复执行触发动作,并尽可能补足与最初报告相似的所有输入。
- 快速检查与该 bug 相关的那段代码。很多时候,你会直接看到某个很可疑的地方,而这反过来又能引导你更准确地重现问题。
- 运行那些覆盖相似功能的自动化测试。自动化测试的一大价值,本来就包括帮助你重现 bug。如果 bug 要在 24 小时测试之后才出现,那显然应该把这 24 小时交给机器,而不是亲自干耗一天。
- 如果你手头硬件条件允许,也可以让几台机器并发运行略有差异的测试变体,有时这样反而能更快定位问题。
- 运行覆盖相似功能的 stress test。如果你的程序是一个 web server,而它在某个请求上崩溃了,那就试试同时开尽可能多的 browser,去发送这个请求。
一旦你能稳定重现 bug,下一步就应尝试把触发它的动作序列缩短到最小。可以先从“只包含最后那个触发动作”的最小序列开始,再逐步把更早的前置动作加回来,直到刚好能稳定触发 bug。这样得到的重现用例最简单、最高效,也最利于你后续定位 root cause,并验证修复是否有效。
调试可重现 Bug
Section titled “调试可重现 Bug”当你已经能稳定且高效地重现某个 bug 时,接下来就该追查代码中究竟是哪部分触发了问题。你在这一阶段的目标,是找到导致问题的确切代码行。通常有两种主要策略:
- 使用 debugger: debugger 允许你逐步执行程序,并在不同时间点查看内存状态和变量值。对定位 bug 根因来说,它往往是不可替代的工具。如果你能访问 source code,就应使用 symbolic debugger,也就是那种能够利用变量名、class 名以及其他 symbol 的 debugger。要使用 symbolic debugger,你必须让 compiler 生成 debug symbol;具体怎么开启,请查阅 compiler 文档。
- 记录 debug message: 如果你在程序中加入足够多的 debug message,并在重现 bug 时观察这些输出,通常也能定位到问题发生的精确位置。如果你手头已经有 debugger,一般不推荐特地再为此大改程序、临时补日志,因为那样既费时,也会改动程序本身。不过,如果你已经像前面所说那样预埋了 debug message,那么在重现 bug 时让程序以 debug mode 运行,往往确实能直接找到根因。要注意的是:有些 bug 会在启用 logging 后“凭空消失”,因为 logging 本身会轻微改变程序的运行时序。
本章结尾的 debugging 示例会同时演示这两种策略。
调试不可重现 Bug
Section titled “调试不可重现 Bug”修复不可重现 bug,通常比修复可重现 bug 难得多。你往往掌握的信息非常少,也不得不依赖大量猜测。不过,下面这些策略仍然会有帮助:
- 尽量把“不可重现 bug”转化成“可重现 bug”。通过一些有根据的猜测,你经常能大致圈定 bug 可能落在哪一片区域。为此多花些时间通常是值得的,因为只要 bug 能被稳定重现,你就可以转而使用前面讲过的可重现 bug 调试方法来追根溯源。
- 分析 error log。如果你已经按前面介绍的方式让程序具备错误日志能力,那么这一步通常很容易做。重点检查 bug 发生之前刚刚记录下的错误,因为它们很可能直接参与了 bug 的形成。如果你足够幸运(或者程序写得足够好),程序甚至可能已经把造成问题的确切原因记录了下来。
- 获取并分析 trace。同样,如果程序已经有 trace 输出,例如前面讲到的 ring buffer,那么这一步也会很顺手。理想情况下,在 bug 发生时你已经拿到了那一段 trace,而它们往往会直接带你回到出错代码位置。
- 检查 crash dump / memory dump 文件(如果存在)。某些平台会在应用异常终止时自动生成 memory dump。在 Unix 与 Linux 上,这类 dump 通常叫 core file。各个平台都有自己的工具来分析这些 dump;例如,它们可以帮助你查看应用崩溃前的 stack trace,以及当时的内存内容。
- 检查代码。很遗憾,这往往是唯一剩下的策略。令人惊讶的是,它其实经常有效。当你带着刚刚发生的 bug 这个上下文,再次审视——甚至是自己写的——代码时,你常常能看到此前完全忽略的错误。我不建议你连续几个小时盯着代码发呆,但顺着代码路径认真手推一遍,往往能直接把你带到问题本身。
- 使用 memory-watching tool,例如本章稍后 “Debugging Memory Problems” 一节会提到的那些工具。这类工具经常能提醒你:程序里存在一些并不总是立即表现为错乱,但很可能就是本次 bug 根源的 memory error。
- 提交或更新 bug report。即便你暂时还没找到 root cause,这份报告也会成为非常有用的历史记录——等下次问题再次出现时,至少别人知道你已经试过什么。
- 如果你始终找不到根因,那至少应补上更多 logging 或 tracing,以便下次 bug 再出现时,你有更大概率抓住它。
一旦你终于找到了某个不可重现 bug 的 root cause,就应马上为它制作一个可重现 test case,并把它转入“reproducible bugs”那一类。真正修 bug 之前,能够重现 bug 非常重要——否则你该如何验证修复?调试不可重现 bug 时,一个很常见的错误,就是修错地方。因为你压根无法稳定重现问题,自然也就无法确认自己到底有没有真正修掉它;于是,过一个月它再冒出来,也就一点都不奇怪了。
调试回归问题
Section titled “调试回归问题”如果某个 feature 出现了 regression bug,就意味着它以前是好的,但在某个时刻意外坏掉了。
调查 regression 时,一个非常实用的技巧,是查看相关文件的 change log。如果你知道这个 feature 在某个时间点之前仍然正常,那就从那个时间点往后检查所有相关改动记录。你经常会看到一些“看起来就很可疑”的变化,而这很可能直接把你带向 root cause。
另一种能显著节省时间的方法,是对旧版本软件使用二分查找思路(通常叫 bisecting),去判断“到底是从哪一版开始坏掉的”。如果你手头保留了旧版 binary,就可以直接用;否则,也可以把 source code 回滚到更旧的 revision。只要你最终找到了“开始出问题的那个时间点”,再去查对应 change log,就往往能看出当时究竟发生了什么。当然,这种方法的前提,依旧是 bug 必须可重现。
调试内存问题
Section titled “调试内存问题”大多数 catastrophic bug——例如应用崩溃——本质上都是由 memory error 引起的。而大量 non-catastrophic bug,背后同样往往埋着 memory error。有些 memory bug 非常明显。例如,如果程序试图解引用一个 null pointer,默认结果通常就是直接终止程序。不过,几乎所有平台也都允许你对这类 catastrophic error 做一些拦截和补救。你到底要为这类恢复投入多少 effort,取决于“对最终用户来说,这种恢复有多重要”。例如,一个文本编辑器理应尽最大努力在崩溃前把用户缓冲区保存下来(哪怕只是保存为某个 “recovered” 文件名);而对另一些程序来说,尽管这种默认崩溃方式很难看,用户却也许仍然能接受。
但有些 memory bug 要狡猾得多。比如,如果你在 C++ 中越界写数组,程序通常并不会在那一刻立刻崩溃。可是,如果那个数组在 stack 上,你可能已经悄悄改掉了另一个变量或另一个数组的值;而这些错误要到程序更后面的某个位置才会真正显露出来。另一方面,如果该数组位于 free store,那么你也可能已经破坏了 free store 本身的内部结构,进而在之后下一次分配或释放动态内存时才引发问题。
第 7 章“内存管理”已经从“写代码时应避免什么”的角度介绍过一些常见 memory error。本节则会从“如何识别已经出错代码中的 memory problem”的角度来看这些问题。因此,在继续本节之前,你应当已经熟悉第 7 章中的相关讨论。
下面这些 memory problem 中的大多数——甚至几乎全部——都可以通过使用 smart pointer 替代 raw pointer 来避免。
内存错误的类别
Section titled “内存错误的类别”想调 memory problem,你首先得熟悉究竟有哪些典型错误。本节会介绍几类主要的 memory error。每一类下都会列出几种不同问题、一个很小的代码示例,以及你可能观察到的 symptom。注意,symptom 并不等于 bug;symptom 是 bug 在运行时表现出来的外在现象。
内存释放错误
Section titled “内存释放错误”下面这张表总结了五种主要的“与释放内存有关”的错误:
| 错误类型 | 症状 | 示例 |
|---|---|---|
| 内存泄漏 | 进程内存占用持续增长;程序运行会随着时间推移越来越慢;最终在某些 OS 上,操作和 system call 会因为内存耗尽而失败。 | void memoryLeak() { int* p { new int[1000] }; return; // Not freeing p! } |
| 分配与释放操作不匹配 | 通常不会立即崩溃,但在某些平台上会导致 memory corruption,并在程序稍后某处表现为崩溃;某些 mismatch 也可能导致 memory leak。 | void mismatchedFree() { int* p1{(int*)malloc(sizeof(int))}; int* p2{new int}; int* p3{new int[1000]}; delete p1; // Should use free()! delete[] p2;// Should use delete! free(p3); // Should use delete[]! } |
| 重复释放内存 | 如果这块内存在两次 delete 之间已经又被重新分配给别处,就可能导致崩溃。 | void doubleFree() { int* p1 { new int[1000] }; delete[] p1; int* p2 { new int[1000] }; delete[] p1; // Freeing p1 twice! } // Leaking memory of p2! |
| 释放未分配的内存 | 通常会直接导致崩溃。 | void freeUnallocated() { int* p{reinterpret_cast<int*>(10)}; delete p; // p not a valid pointer! } |
| 释放栈内存 | 从技术上讲,它是“freeing unallocated memory”的一种特殊情形;通常同样会导致崩溃。 | void freeStack() { int x; int* p { &x }; delete p; // Freeing stack memory! } |
表中提到的这些崩溃,在不同平台上可能会表现为不同形式,例如 segmentation fault、bus error、access violation 等等。
正如你看到的,其中一些错误并不会立刻导致程序终止。这正是它们危险的地方:它们更微妙,也常常让后续程序行为变得难以解释。
内存访问错误
Section titled “内存访问错误”另一大类内存错误,发生在“读写内存本身”的阶段:
| 错误类型 | 症状 | 示例 |
|---|---|---|
| 访问无效内存 | 几乎总会立刻导致程序崩溃。 | void accessInvalid() { int* p {reinterpret_cast<int*>(10)}; *p = 5; // p is not a valid pointer! } |
| 访问已释放内存 | 通常不会立刻崩溃;如果这块内存已经重新分配给别的对象,就可能让一些“奇怪”且危险的值神秘出现在程序中。 | void accessFreed() { int* p1 { new int }; delete p1; *p1 = 5; // The memory pointed to // by p1 has been freed! } |
| 访问其他分配区域中的内存 | 通常也不会立刻崩溃;但可能让其他变量或临时对象出现诡异值,甚至改变程序控制流。 | void accessElsewhere() { int x, y[10], z; x = 0; z = 0; for (int i { 0 }; i <= 10; ++i) { y[i] = 5; // BUG for i==10! element // 10 is past end of array } } |
| 读取未初始化内存 | 一般不会崩溃;除非你把未初始化值当作 pointer 或 array index 去解引用(示例里就是这样)。即便如此,也不是每次都会崩。 | void readUninitialized() { int* p; print("{}",*p);// p is uninitialized! } |
memory-access error 并不总是表现为崩溃。它们也可能只是让程序继续运行,却 quietly 产出错误结果。而错误结果有时会带来非常严重的后果,例如当计算机正在控制机械臂、X 光设备、放疗系统、生命维持系统等外部装置时。
还要注意,这里讨论的无论是 memory-freeing error 还是 memory-access error,其 symptom 都是指“release build 下的默认表现”。debug build 往往会表现不同,而当你在 debugger 中运行程序时,debugger 也可能会在错误刚发生时就直接打断执行。
调试内存错误的建议
Section titled “调试内存错误的建议”memory 相关 bug 经常会表现为:每次运行程序时,它们在代码中“出问题的位置”略有不同。这种现象尤其常见于 free store memory corruption。free store memory corruption 就像一个定时炸弹,只等着你某次尝试在 free store 上分配、释放或使用内存时爆炸。因此,如果你碰到一个“可以稳定重现、但总是在稍微不同位置发作”的 bug,就应该高度怀疑是 memory corruption。
一旦怀疑是 memory bug,你最好的选择是使用专门的 C++ memory-checking tool。很多 debugger 本身就提供“运行程序时顺便检测 memory error”的选项。例如,在 Microsoft Visual C++ debugger 中运行应用的 debug build 时,它通常能抓住前面几节中提到的绝大多数错误。此外,也有一些非常优秀的第三方工具,例如 Rational Software(现 IBM 旗下)的 Purify,以及 Linux 下的 Valgrind(已在第 7 章中提到)。Microsoft 还提供一个免费的下载工具 Application Verifier(作为 Windows SDK 的一部分,https://developer.microsoft.com/windows/downloads/windows-sdk),它可以在 Windows 环境中配合应用的 release build 运行,用来帮助你发现那些微妙的编程错误,比如前面提到的 memory error。这些 debugger / tool 的工作原理,通常是拦截程序自己的内存分配/释放路径,从而检查是否发生了动态内存的误用,例如释放未分配内存、解引用非法内存、或者对数组进行越界写入。
如果你手头没有 memory-checking tool,而常规 debugging 策略又迟迟无效,那就只能退而求其次,做代码检查。首先,尽量把问题区域缩小到一小段代码。然后,一般来说,先去看所有 raw pointer。只要你的代码质量不是特别差,大多数 pointer 本来就应当已经被 smart pointer 包起来了。如果你真的看到 raw pointer,就值得仔细审视它们的用法,因为它们很可能就是问题来源。除此之外,下面这些点也值得重点检查。
对象与类相关错误
Section titled “对象与类相关错误”- 确认所有“内部会动态分配内存”的 class 都拥有正确的 destructor,而且它们释放的内存与自己分配的内存完全一致:既不多,也不少。
- 确认你的 class 在 copy 和 assignment 上的行为是正确的——尤其是 copy constructor 和 assignment operator——详见第 9 章“精通类与对象”。同时,move constructor 和 move assignment operator 也应正确地把源对象中的 pointer 置为
nullptr,避免源对象析构时再次尝试释放那块内存。 - 检查所有可疑的 cast。如果你把某个 object 的 pointer 从一种类型 cast 成另一种类型,务必确认这种转换本身是合法的。只要可能,优先使用
dynamic_cast。
只要你看到 raw pointer 被用于“表达资源所有权”,我都强烈建议你改用 smart pointer,并尽量把类重构成遵循 Rule of Zero(见第 9 章)。这样一来,前面列表前两条所涉及的错误类型,通常就会自然消失。
常见内存错误
Section titled “常见内存错误”- 确保每一次
new都恰好对应一次delete,每一次new[]都恰好对应一次delete[]。同样,每次malloc、alloc或calloc都应恰好配对一次free。为了避免重复释放或释放后继续使用,通常建议在释放内存之后立刻把 pointer 设为nullptr。当然,更好的方案仍然是:不要用 raw pointer 表达资源所有权,直接使用 smart pointer。 - 检查 buffer overrun。只要你在遍历数组,或者从 C-style string 读取/写入数据,就必须确认不会越过数组或字符串边界。很多这类问题,直接改用 Standard Library container 与 string 就能避免。
- 检查是否存在对无效 pointer 的解引用。
- 在 stack 上声明 pointer(其实任何 scalar type 都一样)时,要确保在声明时就初始化它。例如,应写成
T* p{nullptr};或T* p{new T};,而绝不要写T* p;。更进一步,直接用 smart pointer 会更好。 - 同样地,确保 class 中的 pointer data member 总是通过 in-class initializer 或 constructor 被初始化:要么在构造函数中分配内存,要么显式设为
nullptr。这里的最佳方案也依然是 smart pointer。
调试多线程程序
Section titled “调试多线程程序”C++ 自带一套线程支持库,提供了线程本身以及线程间同步所需的机制;详见第 27 章。multithreaded C++ program 非常常见,因此理解它们在调试上有哪些特殊问题也很重要。multithreaded program 中的 bug,往往与操作系统调度时序变化有关,而且通常很难重现。因此,调试 multithreaded program 往往需要一套专门技巧:
- Use a debugger: debugger 对定位某些多线程问题非常有效,例如 deadlock。一旦 deadlock 发生,就立刻打断程序,检查各个线程的状态。你通常能看到:哪些线程被阻塞了,它们卡在了哪一行。再结合 trace log 还原“线程是如何走进 deadlock 的”,往往足以修复这类问题。
- Use log-based debugging: 对某些多线程问题来说,log-based debugging 有时甚至比 debugger 更有效。你可以在 critical section 前后、在获取锁之前与释放锁之后都加上日志。它对调查 race condition 尤其有帮助。不过,也别忘了:一旦你加了日志,程序的运行时序本身会发生轻微变化,而这可能反过来隐藏 bug。
- Insert forced sleeps and context switches: 如果你很难稳定重现某个问题,或者你已经对 root cause 有所猜测,想进一步验证,那么可以通过人为让线程 sleep,来强行改变调度行为。
<thread>在std::this_thread命名空间中提供了sleep_until()和sleep_for(),可用于主动让线程挂起。其睡眠时长分别通过std::time_point或std::duration来指定,这两者都属于第 22 章讨论过的 chrono library。在释放锁前、发出 condition variable 通知前,或者访问共享数据之前故意 sleep 几秒,常常能暴露那些原本难以被看到的 race condition。如果这种调试技巧真的帮你找到了 root cause,那么你接下来的修复必须保证:即使把这些强制 sleep 和 context switch 全部删掉,程序仍然正确。绝不能把这些人为 sleep 留在正式代码中,那只是错误的“修复方式”。 - Perform code review: 回头审查你的线程同步代码,常常非常有助于发现和修复 race condition。要反复去证明“这件事不可能发生”,直到你真正看见它是如何发生的。把这些“证明过程”写成注释也完全值得。同时,不妨找同事来做 pair debugging;她也许能看见你完全忽略掉的东西。
调试示例:ArticleCitations
Section titled “调试示例:ArticleCitations”这一节会给出一个带 bug 的程序,并展示应如何一步步调试并修复它。
假设你所在的团队正在开发一个网页,让用户可以查询“有哪些 research article 引用了某篇特定论文”。这种服务对作者很有用:当他们先找到一篇和自己研究相关的论文后,就可以继续沿着“所有引用它的论文”往外扩展,寻找更多相关工作。
在这个项目中,你负责的部分,是“从文本文件中读取原始 citation 数据”的代码。为了简化场景,假设每篇论文的 citation 信息都保存在它自己的文件中。再进一步假设:文件第一行包含论文的作者、标题与出版信息;第二行永远为空;从第三行开始的后续每一行,则各自表示一条 citation。下面就是一个示例文件,它对应的是计算机科学史上最重要的论文之一:
Alan Turing, "On Computable Numbers, with an Application to the Entscheidungsproblem", Proceedings of the London Mathematical Society, Series 2, Vol.42 (1936-37), 230-265.
Gödel, "Über formal unentscheidbare Sätze der Principia Mathematica und verwandter Systeme, I", Monatshefte Math. Phys., 38 (1931), 173-198.Alonzo Church. "An unsolvable problem of elementary number theory", American J. of Math., 58 (1936), 345-363.Alonzo Church. "A note on the Entscheidungsproblem", J. of Symbolic Logic, 1 (1936), 40-41.E.W. Hobson, "Theory of functions of a real variable (2nd ed., 1921)", 87-88.
ArticleCitations 类的缺陷实现
Section titled “ArticleCitations 类的缺陷实现”你也许会决定这样组织程序:写一个 ArticleCitations 类,让它读取文件并把这些信息存起来。这个类会把第一行论文信息保存在一个 string 中,而 citation 则保存在一个 C-style 的字符串数组中。
这里故意选择 C-style array 显然是一个糟糕设计!真实代码中,你当然应改用 Standard Library container 来保存 citation。这里这么写,只是为了演示 memory problem。此外,这个实现里还存在其他明显问题,比如 assignment operator 没有使用 copy-and-swap idiom(见第 9 章)。不过,作为一个用于说明“程序如何出 bug”的示例,它非常合适。
定义在 article_citations 模块中的 ArticleCitations 类定义如下:
export class ArticleCitations{    public:        explicit ArticleCitations(const std::string& filename);        virtual ~ArticleCitations();        ArticleCitations(const ArticleCitations& src);        ArticleCitations& operator=(const ArticleCitations& rhs);
        const std::string& getArticle() const;        int getNumCitations() const;        const std::string& getCitation(int i) const;    private:        void readFile(const std::string& filename);        void copy(const ArticleCitations& src);
std::string m_article; std::string* m_citations { nullptr }; int m_numCitations { 0 };};实现如下。请始终记住:这段程序本身就是带 bug 的,不要直接照抄,更不要把它当成设计样板。
ArticleCitations::ArticleCitations(const string& filename){    // All we have to do is read the file.    readFile(filename);}
ArticleCitations::ArticleCitations(const ArticleCitations& src){    copy(src);}
ArticleCitations& ArticleCitations::operator=(const ArticleCitations& rhs){    // Check for self-assignment.    if (this == &rhs) {        return *this;    }    // Free the old memory.    delete [] m_citations;    // Copy the data.    copy(rhs);    return *this;}
void ArticleCitations::copy(const ArticleCitations& src){    // Copy the article name, author, etc.    m_article = src.m_article;    // Copy the number of citations.    m_numCitations = src.m_numCitations;    // Allocate an array of the correct size.    m_citations = new string[m_numCitations];    // Copy each element of the array.    for (int i { 0 }; i < m_numCitations; ++i) {        m_citations[i] = src.m_citations[i];    }}
ArticleCitations::~ArticleCitations(){    delete [] m_citations;}
void ArticleCitations::readFile(const string& filename){    // Open the file and check for failure.    ifstream inputFile { filename };    if (inputFile.fail()) {        throw invalid_argument { "Unable to open file" };    }    // Read the article author, title, etc. line.    getline(inputFile, m_article);
    // Skip the whitespace before the citations start.    inputFile >> ws;
    int count { 0 };    // Save the current position so we can return to it.    streampos citationsStart { inputFile.tellg() };    // First count the number of citations.    while (!inputFile.eof()) {        // Skip whitespace before the next entry.        inputFile >> ws;        string temp;        getline(inputFile, temp);        if (!temp.empty()) {            ++count;        }    }
    if (count != 0) {        // Allocate an array of strings to store the citations.        m_citations = new string[count];        m_numCitations = count;        // Seek back to the start of the citations.        inputFile.seekg(citationsStart);        // Read each citation and store it in the new array.        for (count = 0; count < m_numCitations; ++count) {            string temp;            getline(inputFile, temp);            if (!temp.empty()) {                m_citations[count] = temp;            }        }    } else {        m_numCitations = -1;    }}
const string& ArticleCitations::getArticle() const { return m_article; }
int ArticleCitations::getNumCitations() const { return m_numCitations; }
const string& ArticleCitations::getCitation(int i) const { return m_citations[i]; }
测试 ArticleCitations 类
Section titled “测试 ArticleCitations 类”下面这个程序会先向用户询问一个文件名,构造出对应的 ArticleCitations 实例,然后把这个实例按值传递给 processCitations(),由后者把全部信息打印出来。在这个“故意带 bug”的示例里,之所以按值传递,是为了制造问题。在真实生产代码中,你应当按 reference-to-const 传递。
void processCitations(ArticleCitations cit){    println("{}", cit.getArticle());    for (int i { 0 }; i < cit.getNumCitations(); ++i) {        println("{}", cit.getCitation(i));    }}
int main(){    while (true) {        print("Enter a file name (\"STOP\" to stop): ");        string filename;        cin >> filename;        if (filename == "STOP") { break; }
        ArticleCitations cit { filename };        processCitations(cit);    }}
你决定先拿 Alan Turing 那个例子来测试程序(文件名为 paper1.txt)。程序输出如下:
Enter a file name ("STOP" to stop): paper1.txtAlan Turing, "On Computable Numbers, with an Application to the Entscheidungsproblem", Proceedings of the London Mathematical Society, Series 2, Vol.42 (1936-37), 230-265.[ 4 empty lines omitted for brevity ]Enter a file name ("STOP" to stop): STOP这显然不对。本来应该输出 4 条 citation,而不是 4 行空白。
基于消息的调试
Section titled “基于消息的调试”面对这个 bug,你决定先试试 log-based debugging。由于这是个 console application,所以最简单的做法就是直接用 println() 打印调试信息。此时,从负责读取 citation 的函数入手是很自然的选择:如果这一层本身就没把 citation 读对,那么 object 里当然不会有正确内容。于是,你可以把 readFile() 改成下面这样:
void ArticleCitations::readFile(const string& filename){    // Code omitted for brevity.
    // First count the number of citations.    println("readFile(): counting number of citations");    while (!inputFile.eof()) {        // Skip whitespace before the next entry.        inputFile>> ws;        string temp;        getline(inputFile, temp);        if (!temp.empty()) {            println("Citation {}: {}", count, temp);            ++count;        }    }
    println("Found {} citations", count);    println("readFile(): reading citations");    if (count != 0) {        // Allocate an array of strings to store the citations.        m_citations = new string[count];        m_numCitations = count;        // Seek back to the start of the citations.        inputFile.seekg(citationsStart);        // Read each citation and store it in the new array.        for (count = 0; count < m_numCitations; ++count) {            string temp;            getline(inputFile, temp);            if (!temp.empty()) {                println("{}", temp);                m_citations[count] = temp;            }        }    } else {        m_numCitations = -1;    }    println("readFile(): finished");}
用这个程序再次运行同样测试,你会得到如下输出:
Enter a file name ("STOP" to stop): paper1.txtreadFile(): counting number of citationsCitation 0: Gödel, "Über formal unentscheidbare Sätze der Principia Mathematica und verwandter Systeme, I", Monatshefte Math. Phys., 38 (1931), 173-198.Citation 1: Alonzo Church. "An unsolvable problem of elementary number theory", American J. of Math., 58 (1936), 345-363.Citation 2: Alonzo Church. "A note on the Entscheidungsproblem", J. of Symbolic Logic, 1 (1936), 40-41.Citation 3: E.W. Hobson, "Theory of functions of a real variable (2nd ed., 1921)", 87-88.Found 4 citationsreadFile(): reading citationsreadFile(): finishedAlan Turing, "On Computable Numbers, with an Application to the Entscheidungsproblem", Proceedings of the London Mathematical Society, Series 2, Vol.42 (1936-37), 230-265.[ 4 empty lines omitted for brevity ]Enter a file name ("STOP" to stop): STOP从输出可以看出:程序第一次读取 citation(为了统计数量)时,其实读得完全正确。但第二次再读时,就完全读不出来了;在 “readFile(): reading citations” 和 “readFile(): finished” 之间什么都没输出——为什么?一个进一步追查的办法,是在每次尝试读取 citation 之后,顺手打印 file stream 当前的状态:
void printStreamState(const istream& inputStream){    if (inputStream.good()) { println("stream state is good"); }    if (inputStream.bad()) { println("stream state is bad"); }    if (inputStream.fail()) { println("stream state is fail"); }    if (inputStream.eof()) { println("stream state is eof"); }}
void ArticleCitations::readFile(const string& filename){    // Code omitted for brevity.
    // First count the number of citations.    println("readFile(): counting number of citations");    while (!inputFile.eof()) {        // Skip whitespace before the next entry.        inputFile >> ws;        printStreamState(inputFile);        string temp;        getline(inputFile, temp);        printStreamState(inputFile);        if (!temp.empty()) {            println("Citation {}: {}", count, temp);            ++count;        }    }
    println("Found {} citations", count);    println("readFile(): reading citations");    if (count != 0) {        // Allocate an array of strings to store the citations.        m_citations = new string[count];        m_numCitations = count;        // Seek back to the start of the citations.        inputFile.seekg(citationsStart);        // Read each citation and store it in the new array.        for (count = 0; count < m_numCitations; ++count) {            string temp;            getline(inputFile, temp);            printStreamState(inputFile);            if (!temp.empty()) {                println("{}", temp);                m_citations[count] = temp;            }        }    } else {        m_numCitations = -1;    }    println("readFile(): finished");}
这一次运行程序,你会看到一些很有意思的信息:
Enter a file name ("STOP" to stop): paper1.txtreadFile(): counting number of citationsstream state is goodstream state is goodCitation 0: Gödel, "Über formal unentscheidbare Sätze der Principia Mathematica und verwandter Systeme, I", Monatshefte Math. Phys., 38 (1931), 173-198.stream state is goodstream state is goodCitation 1: Alonzo Church. "An unsolvable problem of elementary number theory", American J. of Math., 58 (1936), 345-363.stream state is goodstream state is goodCitation 2: Alonzo Church. "A note on the Entscheidungsproblem", J. of Symbolic Logic, 1 (1936), 40-41.stream state is goodstream state is goodCitation 3: E.W. Hobson, "Theory of functions of a real variable (2nd ed., 1921)", 87-88.stream state is eofstream state is failstream state is eofFound 4 citationsreadFile(): reading citationsstream state is failstream state is failstream state is failstream state is failreadFile(): finishedAlan Turing, "On Computable Numbers, with an Application to the Entscheidungsproblem", Proceedings of the London Mathematical Society, Series 2, Vol.42 (1936-37), 230-265.[ 4 empty lines omitted for brevity ]Enter a file name ("STOP" to stop): STOP从输出中你会发现:stream 在第一次读到最后一条 citation 之前,一直处于 good 状态。但由于 paper1.txt 的结尾还带着一个空行,所以在读完最后一条 citation 后,while 循环又多执行了一次。在这最后一轮里,inputFile >> ws 吃掉了最后一行中的空白,这让 stream state 变成了 eof。随后,代码仍然继续调用 getline() 去读一行,于是 stream state 又变成了 fail 和 eof。这一切都在预期之内。真正奇怪的是:在第二次尝试读取 citation 时,stream state 依然保持在 fail 状态。乍看之下这很不合理,因为代码明明在第二轮读取之前,已经调用了 seekg() 把指针跳回 citation 开始位置。
不过,第 13 章解释过:stream 的错误状态会一直保留,除非你显式把它们清掉;seekg() 不会自动清除 fail 状态。一旦 stream 处于错误状态,它之后的读取操作就会继续失败。这也正解释了:为什么第二次读取 citation 时,stream state 仍然是 fail。仔细看代码就能发现:在第一次读到文件末尾之后,程序从来没有对 istream 调用 clear()。只要补上这一步,citation 就会被正确读出来。
下面是去掉调试输出之后,修正后的 readFile() 实现:
void ArticleCitations::readFile(const string& filename){    // Code omitted for brevity.
    if (count != 0) {        // Allocate an array of strings to store the citations.        m_citations = new string[count];        m_numCitations = count;        // Clear the stream state.        inputFile.clear();        // Seek back to the start of the citations.        inputFile.seekg(citationsStart);        // Read each citation and store it in the new array.        for (count = 0; count < m_numCitations; ++count) {            string temp;            getline(inputFile, temp);            if (!temp.empty()) {                m_citations[count] = temp;            }        }    } else {        m_numCitations = -1;    }}
现在,再用同样的 paper1.txt 测试一次,程序就能正确显示四条 citation 了。
在 Linux 上使用 GDB 调试器
Section titled “在 Linux 上使用 GDB 调试器”现在,既然 ArticleCitations 类在某一个 citation 文件上看起来已经正常工作,你决定继续向前推进,测试一些特殊情况,首先是“完全没有 citation 的文件”。这个文件长这样,并保存在 paper2.txt 中:
Author with no citations当你用这个文件运行程序时,根据 Linux 版本与 compiler 的不同,你很可能会看到类似下面这样的崩溃:
Enter a file name ("STOP" to stop): paper2.txtterminate called after throwing an instance of 'std::bad_alloc' what(): std::bad_allocAborted (core dumped)这里的 “core dumped” 表示程序崩溃了。这一次,你决定真正上 debugger。GNU Debugger(GDB)在 Unix 与 Linux 平台上都极为常见。首先,你需要在编译程序时带上调试信息(使用 g++ 时就是 -g)。随后,就可以在 GDB 下启动程序。下面是一个使用 debugger 找出问题根因的示例会话。假设你的可执行文件名叫 buggyprogram。其中需要你手动输入的文本以粗体显示。
> gdb buggyprogram[ Start-up messages omitted for brevity ]Reading symbols from /home/marc/c++/gdb/buggyprogram...done.(gdb) runStarting program: buggyprogramEnter a file name ("STOP" to stop): paper2.txtterminate called after throwing an instance of 'std::bad_alloc' what(): std::bad_allocProgram received signal SIGABRT, Aborted.0x00007ffff7535c39 in raise () from /lib64/libc.so.6(gdb)程序一崩,debugger 就会中断执行,并允许你查看此刻程序的状态。此时,backtrace,或简写 bt,可以显示当前 stack trace。最近一次操作位于最上方,也就是编号为 0 的 frame(#0)。
(gdb) bt#0 0x00007ffff7535c39 in raise () from /lib64/libc.so.6#1 0x00007ffff7537348 in abort () from /lib64/libc.so.6#2 0x00007ffff7b35f85 in __gnu_cxx::__verbose_terminate_handler() () from /lib64/libstdc++.so.6#3 0x00007ffff7b33ee6 in ?? () from /lib64/libstdc++.so.6#4 0x00007ffff7b33f13 in std::terminate() () from /lib64/libstdc++.so.6#5 0x00007ffff7b3413f in __cxa_throw () from /lib64/libstdc++.so.6#6 0x00007ffff7b346cd in operator new(unsigned long) () from /lib64/libstdc++.so.6#7 0x00007ffff7b34769 in operator new[](unsigned long) () from /lib64/libstdc++.so.6#8 0x00000000004016ea in ArticleCitations::copy (this=0x7fffffffe090, src=...) at ArticleCitations.cpp:39#9 0x00000000004015b5 in ArticleCitations::ArticleCitations (this=0x7fffffffe090, src=...) at ArticleCitations.cpp:15#10 0x0000000000401d0c in main () at ArticleCitationsTest.cpp:23面对这种 stack trace,你应当尝试从上往下找到“第一条属于你自己代码”的 stack frame。在这个例子里,它是 #8。从这个 frame 你可以看出,问题似乎出在 ArticleCitations 的 copy() 成员函数中。这个函数之所以被调用,是因为 main() 调用了 processCitations(),并把参数按值传了进去,这触发了 copy constructor,而 copy constructor 又进一步调用了 copy()。当然,真实生产代码里你应该传 reference-to-const;这里只是为了构造这个带 bug 的示例,才故意使用 pass-by-value。你可以通过 frame 命令跳转到 #8 这个 frame,只需把想跳转的 frame 编号传给它即可:
(gdb) frame 8#8 0x00000000004016ea in ArticleCitations::copy (this=0x7fffffffe090, src=...) at ArticleCitations.cpp:3939 m_citations = new string[m_numCitations];这行输出表明,下面这一句出了问题:
m_citations = new string[m_numCitations];接着,你可以使用 list 命令,把当前 frame 中出错行附近的代码打印出来:
(gdb) list34 // Copy the article name, author, etc.35 m_article = src.m_article;36 // Copy the number of citations.37 m_numCitations = src.m_numCitations;38 // Allocate an array of the correct size.39 m_citations = new string[m_numCitations];40 // Copy each element of the array.41 for (int i { 0 }; i < m_numCitations; ++i) {42 m_citations[i] = src.m_citations[i];43 }在 GDB 中,你可以用 print 命令输出当前作用域内可见的变量值。为了找到根因,一个很合理的起点,是打印 src 参数,因为错误正发生在 copy() 成员函数内部:
(gdb) print src$1 = (const ArticleCitations &) @0x7fffffffe060: { _vptr.ArticleCitations = 0x401fb0 <vtable for ArticleCitations+16>, m_article = "Author with no citations", m_citations = 0x000000000000, m_numCitations = -1}啊哈!问题来了。这篇文章本来就不该有任何 citation,那为什么 m_numCitations 会被设成这个奇怪的值 -1?回头再看 readFile() 中“没有 citation 时”的那段代码,你会发现:原来在这种情况下,m_numCitations 被错误地设成了 -1。修复其实很简单:没有 citation 时,它也应该被初始化为 0,而不是 -1。与此同时,还存在另一个问题:readFile() 其实可能在同一个 ArticleCitations object 上被调用多次,因此你还需要先释放旧的 m_citations 数组。修正后的代码如下:
void ArticleCitations::readFile(const string& filename){    // Code omitted for brevity.
    delete [] m_citations;  // Free previously allocated citations.    m_citations = nullptr;    m_numCitations = 0;    if (count != 0) {        // Allocate an array of strings to store the citations.        m_citations = new string[count];        m_numCitations = count;
        // Code omitted for brevity.    }}
正如这个例子所展示的,bug 往往不会立刻显现出来。很多时候,你必须借助 debugger,再加上一点耐心,才能真正把它挖出来。
使用 Visual C++ 2022 调试器
Section titled “使用 Visual C++ 2022 调试器”这一节会演示和前一节相同的调试流程,只不过改用 Microsoft Visual C++ 2022 debugger,而不是 GDB。
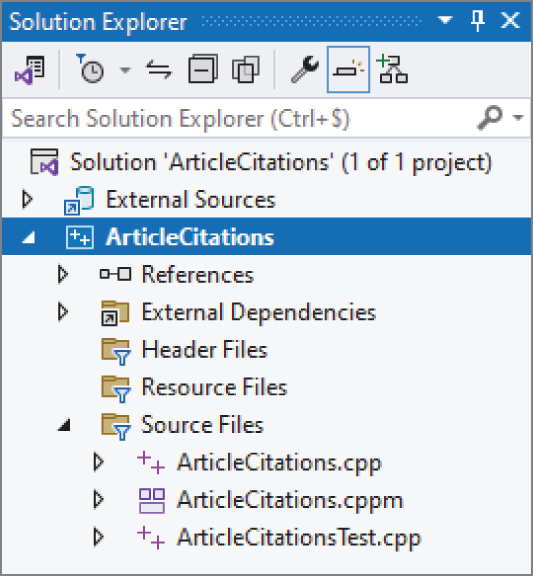
第一步,先创建项目。你可以在 Visual Studio 2022 欢迎界面点击 New Project,也可以直接通过 File ➪ New ➪ Project 进入创建流程。在 Create A New Project 对话框中,搜索带有 C++、Windows 和 Console 标签的 Console App 模板,然后点击 Next。将项目命名为 ArticleCitations,选择一个保存项目的目录,再点击 Create。项目建好之后,你会在 Solution Explorer 中看到一组项目文件。如果看不到这个窗口,就去 View ➪ Solution Explorer 打开。项目会默认包含一个叫 ArticleCitations.cpp 的文件,位于 Source Files 树下。请在 Solution Explorer 中选中它并删除,因为我们将加入自己的文件。
接下来把所需文件加入项目。右键 Solution Explorer 中的 ArticleCitations 项目,选择 Add ➪ Existing Item。把下载源码包中 06_ArticleCitations\04_AfterLogDebugging 目录下的全部文件加入项目。此时,你的 Solution Explorer 应当会类似图 31.1。
[^FIGURE 31.1]
这个示例使用了 C++23 特性,而截至本书写作时,这些特性在 Visual C++ 2022 中默认尚未启用。要打开它们,请在 Solution Explorer 中右键 ArticleCitations 项目,点击 Properties。在 Properties 窗口中,进入 Configuration Properties ➪ General,把 C++ Language Standard 设为 “ISO C++23 Standard” 或 “Preview - Features From The Latest C++ Working Draft”,以你当前 Visual C++ 版本中可见的选项为准。前者在本书写作时还不一定存在,但在未来更新中会出现。仍在 Properties 窗口中时,再进入 Configuration Properties ➪ C/C++ ➪ Command Line,添加 /utf-8 作为 Additional Options。这样可以确保诸如 Gödel 中的 ö 这类字符被正确输出。
确认当前配置为 Debug 而不是 Release,然后通过 Build ➪ Build Solution 编译整个程序。接着,把测试文件 paper1.txt 与 paper2.txt 复制到你的 ArticleCitations 项目目录,也就是包含 ArticleCitations.vcxproj 的那个文件夹。
随后,通过 Debug ➪ Start Debugging 运行程序,并先输入 paper1.txt 测试。程序应当能够正确读取文件并把结果输出到控制台。然后,再测试 paper2.txt。此时 debugger 会打断程序,并显示类似图 31.2 的消息。
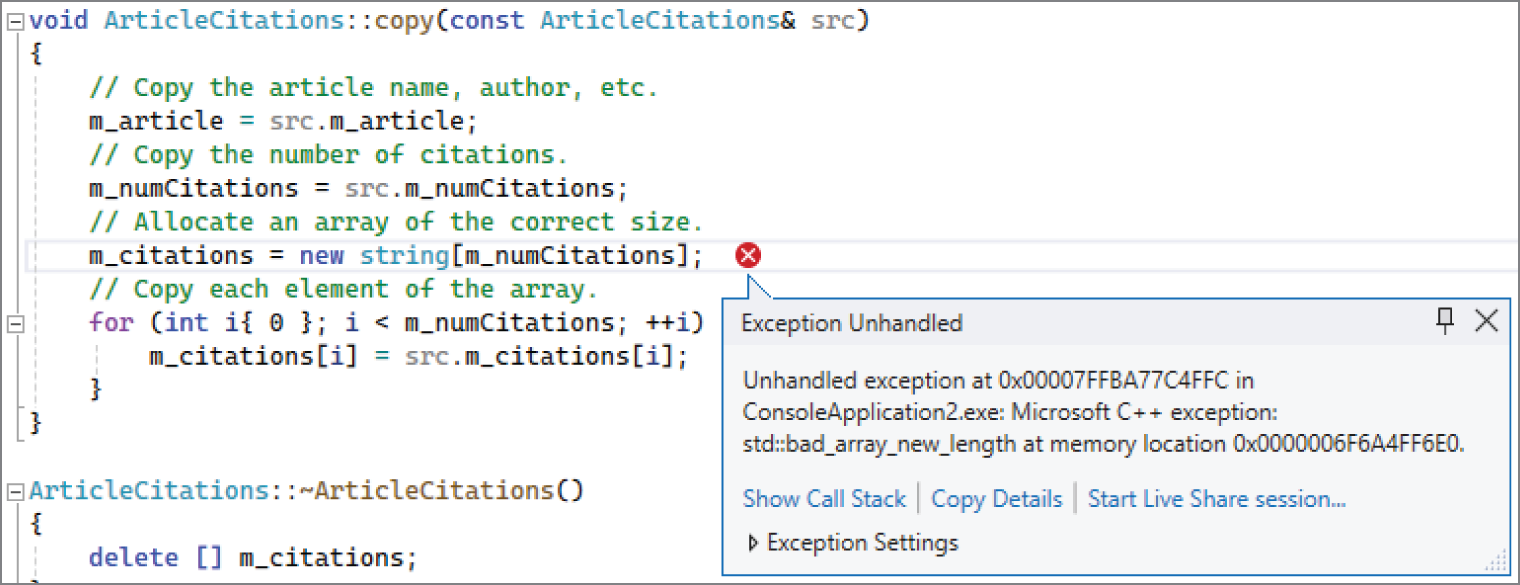
[^FIGURE 31.2]
这说明程序抛出了一个 std::bad_array_new_length exception。如果你当前看到的并不是自己写的代码,那就需要继续追到“到底是你自己的哪一行代码引发了这个 exception”。做法是打开 call stack window(Debug ➪ Windows ➪ Call Stack),然后在 call stack 里找到第一条属于你自己代码的那一行,如图 31.3 所示。你可以双击 call stack 中的某一行,直接跳到对应代码位置。
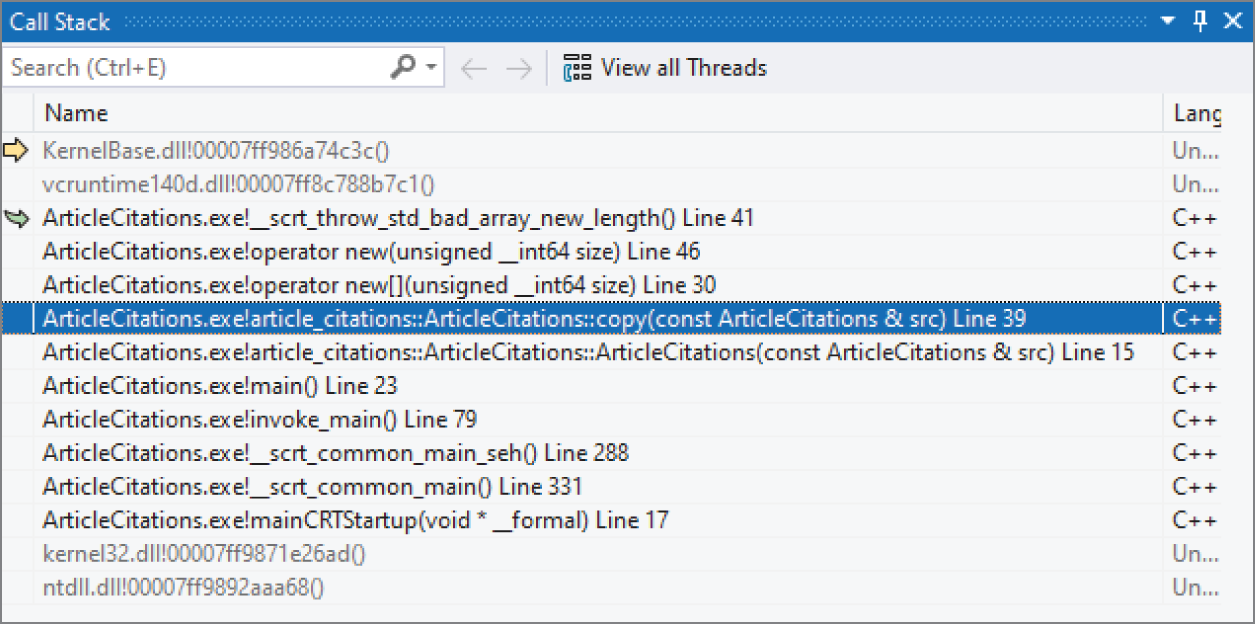
[^FIGURE 31.3]
和 GDB 一样,你会发现问题同样出在 ArticleCitations::copy() 里。
接下来,你可以直接把鼠标悬停到变量名上来查看变量值。如果你把鼠标停在 src 上,就会发现 m_numCitations 的值是 -1。其原因与修复方式,都与 GDB 示例中完全相同。
除了鼠标悬停之外,你也可以通过 Debug ➪ Windows ➪ Autos window 查看变量。图 31.4 展示了这个窗口的样子,其中 src 已被展开,可以看到它的数据成员。从这里同样可以直接确认:m_numCitations 的值确实是 -1。
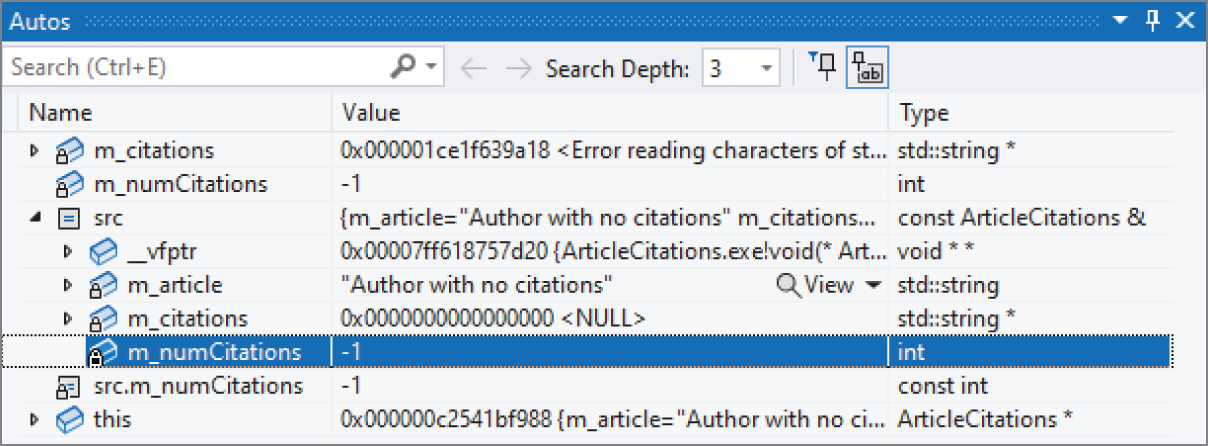
[^FIGURE 31.4]
从 ArticleCitations 示例中得到的经验
Section titled “从 ArticleCitations 示例中得到的经验”你也许会倾向于把这个例子看得太轻,觉得它规模太小,不足以代表现实中的 debugging。虽然这段 buggy 代码本身并不长,但即便在大型项目中,你实际编写的很多 class,其长度也未必会比它大多少。想象一下:如果你没能在把它集成进更大项目之前,认真测试这个例子,那么这些 bug 一旦在更后面才暴露出来,你和其他工程师就必须先花大量时间缩小问题范围,才能继续像这里这样进行 debugging。更重要的是,这个例子中演示的 technique,并不局限于小程序——它们适用于大大小小的调试场景。
本章最重要的概念,就是 debugging 的基本法则:写代码时尽量避免 bug,但同时也要为代码中的 bug 提前做好准备。程序员面对的现实是:bug 一定会出现。如果你已经提前为程序加入了 error logging、debug trace 和 assertion,那么真正发生 bug 之后,debugging 会容易得多。
本章还介绍了一组具体的 debugging 方法。调试时最重要的一条规则,就是先把问题重现出来。之后,你就可以使用 symbolic debugger,或者 log-based debugging,去追踪真正的 root cause。memory error 尤其棘手,而且在 legacy C++ 代码中,它们几乎是 bug 的头号来源。本章也介绍了 memory bug 的若干类别及其 symptom,并通过实例展示了如何在程序中调试这类错误。
Debugging 是一项很难学透的技能。想把自己的 C++ 水平真正提升到专业级,你就必须反复练习 debugging。
通过完成下面这些练习,你可以巩固本章讨论的内容。所有练习的参考解答都包含在本书网站 www.wiley.com/go/proc++6e 提供的代码下载包中。不过,如果你在某道题上卡住了,建议先回过头重读本章相关部分,尽量自己找到答案,再去看网站上的解答。
-
练习 31-1: debugging 的基本法则是什么?
-
练习 31-2: 你能在下面这段代码中发现问题吗?
import std;using namespace std;int* getData(int value) { return new int { value * 2 }; }int main(){int* data { getData(21) };println("{}", *data);data = getData(42);println("{}", *data);} -
练习 31-3: 给定下面这段代码:
import std;using namespace std;int sum(int* values, int count){int total { 0 };for (int i { 0 }; i <= count; ++i) { total += values[i]; }return total;}int main(){int values[] { 1, 2, 3 };int total { sum(values, sizeof(values)) };println("{}", total);}它本来应该计算一组值的总和。对 1、2、3 这三个值而言,你当然会预期结果是 6;但在我的机器上运行时,debug build 得到的是 -2,而 release build 每次得到的却又都是不同随机值,例如 920865056、-321371431 等等。这到底发生了什么?请使用 symbolic debugger 以及它的单步执行模式,精确找出导致错误结果的 root cause。具体如何逐行单步执行,请查阅你所用 debugger 的文档。
-
练习 31-4:(advanced)把本章前面 start-time debug mode 的例子改写成使用
std::source_location(见第 14 章),从而彻底去掉旧式的LOG()macro。这比听起来更 tricky。问题在于:Logger::log()是一个 variadic function template,因此你不能只是简单地在 variadic parameter pack 后面再加一个具名source_location参数。一个常见技巧,是引入一个 helper class,比如Log。让它的 constructor 接收 variadic parameter pack 和source_location,然后再把真正工作转发给Logger::log()。这个技巧的最后一部分,是下面这条 deduction guide;相关讨论见第 12 章“使用模板编写泛型代码”:template <typename... Ts>Log(Ts&&...) -> Log<Ts...>;